Table of Contents
Kentucky’s regulatory code has expanded rapidly in recent years, growing roughly twice as fast as the median state since 2020. By 2025, the commonwealth had nearly 127,000 regulatory restrictions, leaving it more regulated than the median state and among the most regulated in its region on a per-capita basis.
This accumulation carries meaningful economic costs. A larger and more complex regulatory code suppresses investment, productivity growth, and startup formation while raising consumer prices and slowing wage growth. These effects fall disproportionately on small businesses and lower-income households and can also undermine regulatory compliance by overwhelming firms and workers with excessive complexity.
Educate your inbox. Get the Bluegrass Institute's once-weekly policy update.
At the same time, Kentucky’s large regulatory footprint presents a clear opportunity. The report examines two proven reform strategies—targeted red-tape reduction and regulatory budgeting—that have reduced regulatory burdens and improved economic performance in other jurisdictions without expanding government. Recent reforms in states such as Virginia demonstrate that meaningful reductions can be achieved with modest administrative resources.
To estimate the potential gains from reform, the report models four scenarios in which Kentucky reduces regulatory restrictions by 10%, 20%, 30%, or 40% over a three-year period. In every case, economic growth increases. Annual GDP growth rises by an estimated 0.16 to 1.56 percentage points, depending on the scale of reform.
Over time, these gains compound. By 2037, even limited reform would leave Kentucky’s economy about $4 billion larger than under the status quo, while more ambitious reductions could add up to $42 billion in economic output—roughly the equivalent of creating four to five bourbon industries from scratch.
In short, Kentucky’s regulatory burden is not merely a constraint on growth but a lever for reform. Even modest reductions would yield substantial economic benefits, while deeper reforms could significantly strengthen the commonwealth’s competitiveness, innovation, and long-term prosperity.
Introduction
The Trump administration in Washington is focused on shrinking the size of the administrative state, but the regulations issued by federal bureaucracies are not the only rules that need re-sizing. In most states, regulations have been piling up for decades in parallel with the federal regulations, often without a systematic process for reviewing or removing outdated, duplicative, or unnecessarily burdensome rules. In Kentucky, the buildup of rules in recent years has been particularly pronounced.
While Kentucky remains close to the median in terms of ranking across all states and D.C., the growth of regulations in Kentucky has double the growth rate of the median state since 2020. This pattern reflects a broader phenomenon known as regulatory accumulation, in which new regulations are added more readily than old ones are revisited or removed. Over time this process leads to a steadily expanding stock of regulatory requirements, regardless of whether earlier rules remain effective or necessary.
As a result of this accumulation, Kentucky has amassed, as of 2025, 126,891 regulatory restrictions. These restrictions are words and phrases such as “shall,” “must,” and “may not” that appear in the text of regulations and typically create prohibitions or obligations. On their own, those commands could fill a serious novel, before accounting for the context, definitions, exceptions, and guidance that surround them. The presence of so many restrictions has imposed a significant costs in time and resources on businesses and households alike, especially small and medium-sized enterprises and lower income households.
But Kentucky’s outsized regulatory code also represents an opportunity for policymakers. Because so much regulatory accumulation has occurred, even targeted reforms have the potential to meaningfully boost the state’s economy. If Kentucky were to reduce its regulatory burden by 25% over the next three years, it could unlock significant economic potential. Experiences in other jurisdictions—including Idaho, Virginia, and the Canadian province of British Columbia—demonstrate that it is possible to reduce regulatory burdens systematically while maintaining core protections and improving economic performance.
This report explores how Kentucky might realize such regulatory reform and estimates the potential gains Kentucky could experience from a targeted reduction of 10%, 20%, 30%, or 40% in regulatory red tape. Using data from State RegData and evidence from prior reform efforts, the analysis models how different reform scenarios would affect the state’s long-run economic growth.
Across all scenarios examined, economic growth increases substantially. The estimated boost to growth ranges from 0.16 percentage point (pp) under a 10% reduction to 1.56 pp under a 40% reduction. Over time, these gains compound, translating into an increase in the size of Kentucky’s economy ranging from $4 to 42 billion by 2037.
Kentucky’s Regulatory Burden Compared to Other States
To understand the significance of Kentucky’s regulatory growth, it is useful to compare the state’s experience to that of other states. State RegData has annual data for nearly all 50 states from 2020 to 2024 as well as data for some of the states for 2025. The project involves collecting all of the regulations in effect in each state at a specific point in time and using AI to quantify specific dimensions of those regulations. Primary among the metrics that State RegData produces is the popular regulatory restrictions metric. Regulatory restrictions is used in all the RegData datasets to serve as a proxy for the prohibitions (e.g., you may not do this) and obligations (e.g., you must do that) contained in regulatory text.
Figure 1 shows the quantity of regulatory restrictions on the books for Kentucky for years 2020 to 2024. Over that period, regulatory restrictions in Kentucky have grown by 8.8%, from 115,938 to 126,140. Meanwhile, the median state’s regulations have increased 4.4% over the same time period—meaning Kentucky’s regulatory code has grown twice as fast as the median state between 2020 and 2024.
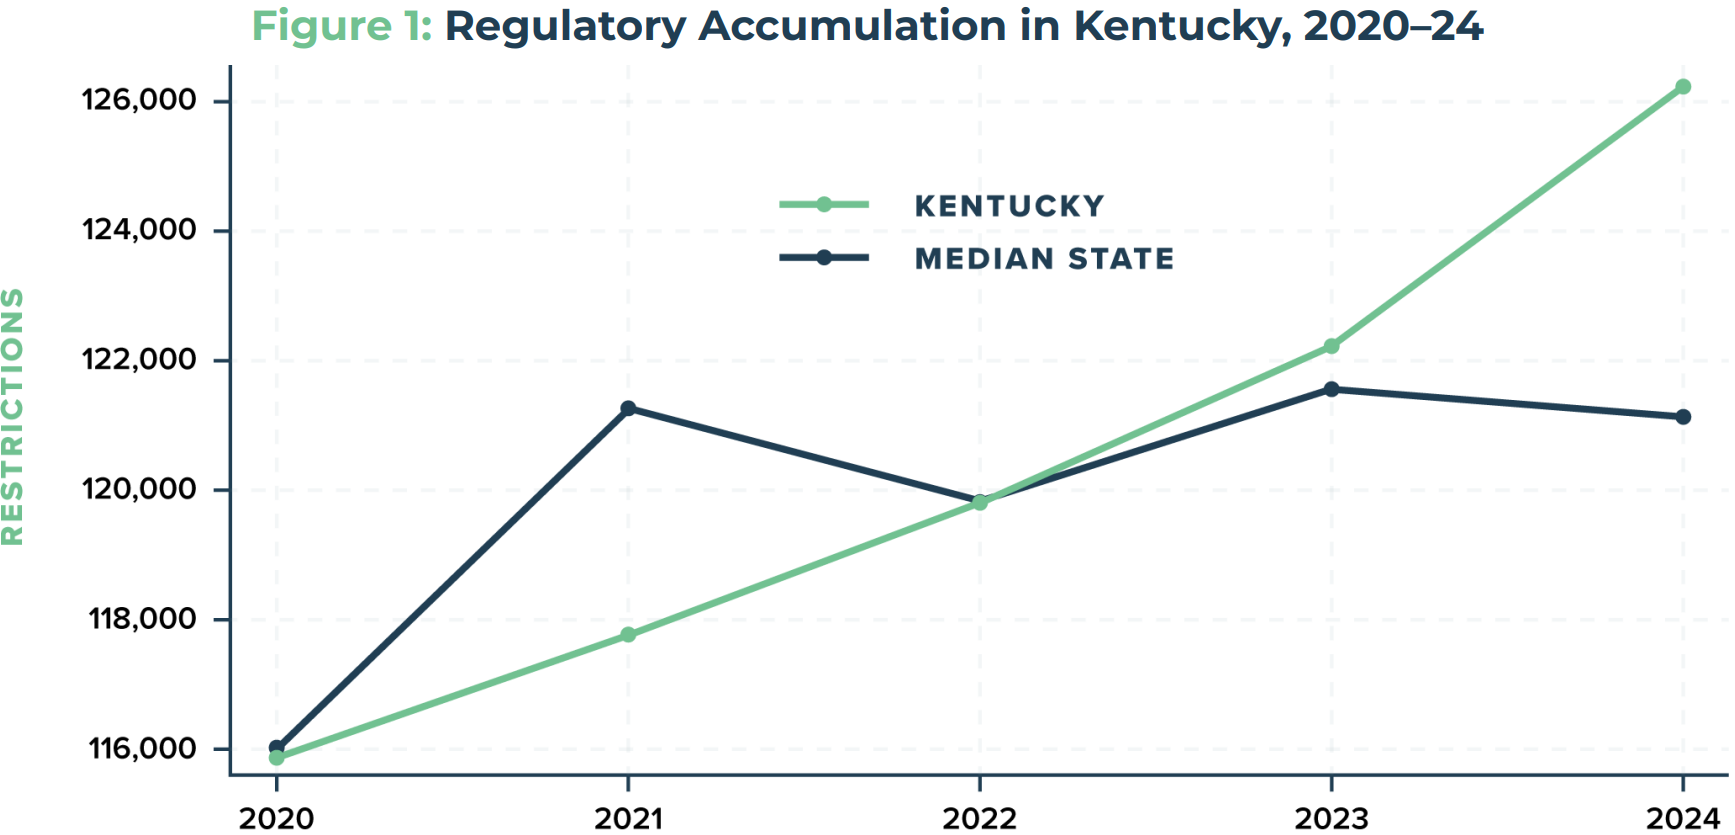
By way of comparison, that rate of regulatory growth exceeds the national average, as the slope of the two lines in Figure 1 show. While Kentucky was less regulated than the median state in 2020 and 2021 and was the median state in 2022, Kentucky is now more regulated than the median state. As of 2024, Kentucky was 4% more regulated than the median state (Tennessee). The least regulated state, Idaho, had 27,800 restrictions in 2024. By our measures, Kentucky is about 4.54 times more regulated than Idaho.
To put the length of Kentucky’s regulatory code into more familiar context, the roughly 6.4 million words contained in the code is nearly eight times the length of the entire KJV Bible. At a brisk reading pace of 250 words per minute, it would require 50 of this year’s 60 day legislative session just to get through the text once.
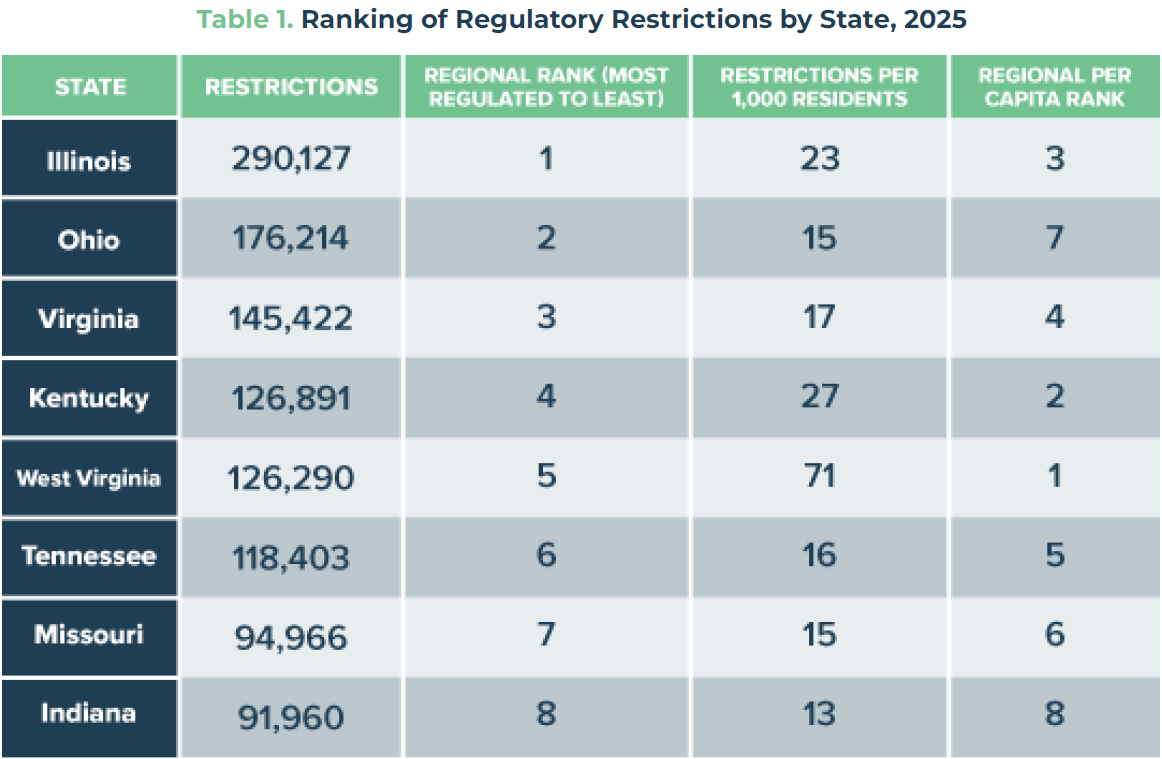
While it is not shown in the figure above, Kentucky’s regulations continued to grow in 2025, totaling 126,891 restrictions. While 2025 data is not yet available for all 50 states, the Kentucky region’s data for 2025 is complete—permitting a comparison with neighboring states. Kentucky ranks as the fourth most regulated state in the region, trailing only the much more populous states of Illinois, Ohio, and Virginia. On a per capita basis, Kentucky is the second most regulated state in the region. This is shown in Table 1.
Economic and Social Consequences of Regulatory Accumulation
Regulatory accumulation refers to the steady and perhaps unintentional growth of regulations over time. Without a systematic approach to reviewing and removing outdated or redundant regulations, the steady buildup of government interventions eventually shows up in economic outcomes ranging from business activities such as investment decisions, startup rates, and productivity growth to household outcomes such as household income and consumer expenditure.
Business and Investment Effects
The downsides of regulatory accumulation are well documented. A landmark study published in 2020 showed that regulatory accumulation slows economic growth by nearly one percentage point annually. Specifically, the study found that the buildup of more and more federal regulations over time distorted business investment decisions, which, in the long run, are the drivers of innovation and productivity growth. Coffey et al. also found that the buildup of federal regulations has created a considerable drag on the economy, amounting to an average reduction of 0.8 percentage point in the annual growth rate of the US GDP.
This seemingly small annual reduction has large implications. The slower economic growth associated with regulatory accumulation resulted in an economy that was $4 trillion smaller in 2012 than it could have been without such regulatory accumulation. That amount equaled about a quarter of the US economy in 2012, and if it were a nation’s GDP, it would have been the fourth largest in the world at that time. This translates to a loss in real income of approximately $13,000 per year for every American.
A similar study estimated the effect to be even larger, finding that regulatory accumulation slowed US economic growth by as much as 2 percentage points annually. This sort of research shows that the total cost of regulations is greater than the sum of the projected compliance costs when each regulation is analyzed on its own. Forgone innovation, and the opportunity cost it implies, eventually makes compliance costs seem relatively trivial in comparison. Not coincidentally, research shows that regulatory accumulation disproportionately burdens small businesses—including the startups that are often the fountainheads of innovation—and that this burden grows at an increasing rate as regulation accumulates (i.e., the negative effect of each new regulation grows larger as the stock of regulation grows larger).
Regulatory Complexity, Compliance, and Safety
There are other reasons that business leaders should be concerned about regulatory accumulation. Scholarship from the fields of psychology, economics, and organizational science suggests that people are more likely to make mistakes and are less motivated and able to comply when they are required to follow too many rules simultaneously. For example, one study found that the growth in regulation in the nuclear power industry actually reduced safety. New regulations only distracted workers from their most important duties. In such circumstances, it became harder for workers to focus on averting the greatest risks, as an increasing share of their attention was diverted to recalling all the rules they were supposed to follow.
Numerous other studies on safety regulations have reinforced these findings. Some 95% of Dutch railroad workers reported that they could not do their jobs if they followed all the rules. Similarly, British railroad workers admitted that more than half of all rule breaches were intentional, because they could not accomplish their jobs otherwise. And workers in the Australian mining industry became less concerned with evaluating situations of actual safety and more concerned with avoiding sanctions.
The bottom line on regulations and workplace safety is that when too many regulations occupy their focus, workers can lose a sense of ownership of safety procedures, which has serious repercussions. Although their local knowledge allows workers to identify problems more easily than regulators, they become less motivated to find solutions. At best, workers focus on simply following the rules, even if they are not safety-enhancing. At worst, they focus on how to break the rules without getting caught. Reducing the complexity of the regulatory system is a powerful way to improve compliance and generate better outcomes from regulations that serve a justified purpose.
Household Effects
While regulation significantly affects business-related economic outcomes, regulation also has direct impact on American households, especially households with lower incomes. By creating barriers or hurdles that limit the ability of new individuals or companies to enter a market, regulatory accumulation can raise prices (through reduced competition), slow wage growth, and diminish economic opportunities for low-income workers.
Regulation typically increases the production costs of goods, and these costs are passed on to the consumer in the form of higher prices. A study published in 2017 combined data from the Bureau of Labor Statistics, the Bureau of Economic Analysis, and the RegData database to study the relationship between prices and consumer choices. They found that a 10% increase in total regulation leads to a nearly 1% increase in consumer prices. Furthermore, they found that the effects of these price increases are regressive: The poorest income groups experience the highest proportional increases in the prices they pay.
This is consistent with spending patterns broken down by income level. Low-income households tend to spend a greater portion of their incomes on necessities such as utilities, food, and healthcare; unfortunately, these goods also tend to be more regulated than other consumer and household goods. It is perhaps not surprising, then, that regulatory accumulation also has a positive statistical relationship with poverty rates; as regulation grows, poverty rates also tend to rise. Regulatory accumulation can also contribute to income inequality as wage growth shifts from low-income workers to compliance-related workers such as managers, lawyers, and accountants.
Proven Strategies Reverse Regulatory Accumulation
The good news is that there are proven ways to reverse the problem in Kentucky. Considering evidence on the harms of regulatory accumulation, several states have implemented regulatory reform initiatives designed to identify and weed out red tape that had accumulated over the years. The movement was arguably inspired by the Canadian province, British Columbia, which in 2001 recognized a need to cut some of the regulatory red tape that had built up over years. British Columbia’s groundbreaking red-tape reduction initiative succeeded in reducing the quantity of regulations on its books by about 40 percent within three years. Coffey and I found that the red-tape reduction caused the province’s economic growth rate to increase by over one percentage point, converting British Columbia from economic laggard to leader in just a few years. And the new, higher growth rate was maintained for several years thereafter.
The states that have enacted successful regulatory reforms have primarily adopted two similar approaches: targeted red-tape reductions and regulatory budgets. The former—a targeted reduction—typically involves developing a quantitative measurement of accumulated regulation and then setting an explicit target for reduction, such as 25% or 30% relative to the initial baseline. The latter—regulatory budgeting—comes in a variety of forms, but it also typically requires first coming up with a quantitative metric of total regulatory burden and then tracking changes as new regulations are made or old regulations are modified or eliminated.
These approaches are effective. The states of Idaho and Virginia offer instructive examples of successful regulatory reform in the United States. In 2016, Idaho was not the least regulated state in the nation. It required deliberate reform of the regulatory process, which has been a hallmark of Idaho Governor Brad Little’s time in office. Over the past several years, Idaho has implemented a bold regulatory reform agenda, resulting in a reduction of its regulatory restriction count by more than 50%. With one of his first executive orders, Governor Little implemented a one-in, two-out regulatory policy, requiring that for every new regulatory restriction introduced, two must be eliminated.
This approach eventually evolved into a form of regulatory sunsetting called “zero-based regulation,” modeled after zero-based budgeting. Under zero-based budgeting, all state agencies must review all their regulations once every five years. If an agency wants to keep a rule on the books, the burden of proof is on the agency to show that the regulation is necessary and that the least restrictive alternative has been chosen. The results helped Idaho reduce its regulatory complexity and foster a more dynamic business environment, especially for small- and medium-size enterprises. And, not coincidentally, Idaho's economic growth outpaced national averages, and the state became a magnet for investment and entrepreneurship.
More recently, the neighboring state of Virginia pioneered a slightly different approach to cutting red tape. Soon after taking office in 2022, Governor Glenn Youngkin directed Virginia agencies to pursue a sweeping reduction in regulatory burdens, setting a goal of eliminating one quarter of existing requirements by the end of his term. That benchmark has now been met. State officials expect the total reduction to reach roughly one-third of all regulatory requirements, alongside a 50% cut in the length of guidance documents, by the time the administration concludes. These results are not the product of accounting tricks or symbolic gestures. Virginia undertook a rigorous, ground-up inventory of its regulatory system, capturing not only formal rules but also incorporated third-party standards and agency guidance that carry regulatory force. Each modification has been carefully documented and publicly disclosed through the state’s regulatory town hall portal.
The payoff from this effort has been substantial. To date, the reforms are estimated to save Virginians more than $1.2 billion annually. Those savings stem from a wide range of actions, including scaling back excessive licensing requirements—such as mandated training hours for cosmetologists—and simplifying rules that govern housing construction. In the housing context alone, regulatory streamlining is projected to reduce the cost of building a new home by about $24,000 while also accelerating project timelines for builders and contractors.
Perhaps most striking is how modest the administrative footprint has been in Virginia. The Office of Regulatory Management, created to coordinate and enforce these reforms, operates with just four full-time staff members: a director, a deputy director, and two policy analysts. Looking ahead, advances in artificial intelligence are likely to further lower the cost of identifying, tracking, and evaluating regulatory requirements, making this kind of reform even more accessible to other states.
Economic Gains from Cutting Red Tape
Evidence from Prior Research
A systematic reduction of regulatory burdens in Kentucky by 25% could result in significant economic gains. In our study of British Columbia’s regulatory reform, Coffey and I found that cutting red tape by 36% can boost GDP growth by roughly 1 percentage point annually. Such an increase in Kentucky’s growth rate would add billions to the economy each year. The effects would ripple throughout the economy, increasing household incomes, stimulating investment, and creating new jobs.
However, the benefits would not be limited to increased GDP growth. Reducing regulatory complexity also encourages innovation by freeing up resources that businesses can reinvest in new technologies, research, and development. Moreover, reducing regulatory burdens could foster more competition, allowing smaller firms to enter the market, compete effectively, and contribute to job creation. In the ongoing competition between states to create the best business environment, Kentucky can become more appealing to businesses looking to escape the inhibitive tax and regulatory environments in other states.
Simulations of Kentucky’s Growth Trajectory with Regulatory Reform
To better understand the potential impact of regulatory reform in Kentucky, I modeled four scenarios where Kentucky reduces its regulatory restriction count: 10%, 20%, 30%, and 40%t reductions, all accomplished over the next three years. Each scenario incorporates different rates of additional annual growth owing to the reduction in regulatory red tape. The additional growth gained from each scenario is shown in Table 2 and described below.
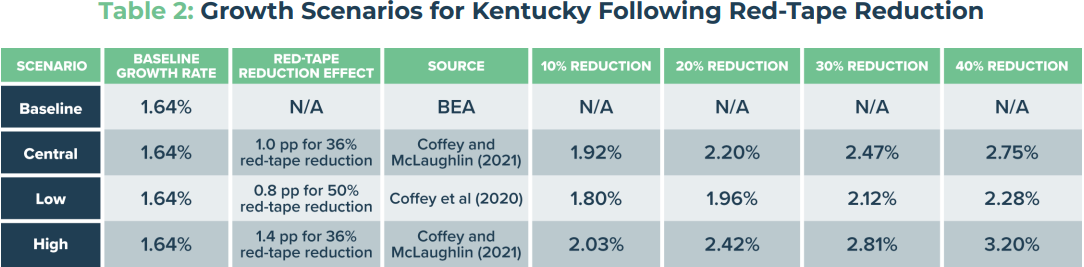
The various scenarios are a combination of the effects of red-tape reduction, and the outcomes of any regulatory reform—which is to say, the percentage of regulations that are cut under a hypothetical regulatory reform in Kentucky. The effects of the reduction are based on the research of Bentley Coffey and myself. Coffey and I estimate the effect of British Columbia’s red-tape reduction. In that study, the preferred estimate is 1.0 pp gained from a 36% reduction to regulations, and the high estimate is 1.4 pp gained from a 36% cut. Coffey et al. (2020) simulate the effect on the national economy if regulations were held constant at the level observed in the 1980, instead of growing to the level observed in 2012. The difference is about a 50% reduction in regulations, which corresponds in their simulation to a 0.8 pp increase in growth.
I use these estimates—1.4 pp, 1.0 pp, and 0.8 pp—to create projections of Kentucky’s economy in future years under different regulatory reduction outcomes. As a starting point, I collected economic growth rate data from the Bureau of Economic Analysis. Based on the average growth observed in Kentucky’s economy over the past decade (2013 to 2023), I assume a 1.64% compound annual growth rate (CAGR) in real GDP. This rate reflects the average historical growth rate observed over the past ten years. All projections for future years’ real GDP are therefore expressed in real 2017 dollars, adjusted for inflation, to ensure consistency and comparability across time.
The regulatory reform outcomes I entertain are: no change to the regulatory process (baseline), a 10% reduction in total regulatory restrictions achieved at the end of three years, a 20% reduction after three years, a 30% reduction after three years, and a 40% reduction after three years. To calculate the effect of each of these reduction outcomes, I calculate the fraction of red-tape reduction achieved in the outcome being entertained relative to the reduction achieved in the relevant study and then multiply that fraction and the red-tape reduction boost for each scenario. For example, for the 30% reduction outcome, the high estimate, in which a 1.4 pp boost would be gained from a 36% red-tape reduction, the 1.4 pp growth boost is multiplied by (30/36), or 0.833, yielding a 1.4 x 0.833 = 1.167 pp increase in the growth rate. This is added to the baseline growth rate of 1.64%, yielding 2.81% growth in that scenario and red-tape reduction outcome.
Projected Growth Effects Under Alternative Reform Scenarios
Any of these scenarios would clearly increase the average growth rate in Kentucky. The boost to growth ranges from 0.16 pp (low effect, 10% reduction) to 1.56 pp (high effect, 40 percent reduction). But even for the low end of this range, the difference between the size of Kentucky’s economy after 10 years under a reform scenario versus the baseline scenario is significant. This is best shown in figure 3, which shows simulations of Kentucky state GDP through 2037. These simulations assume that any red-tape reduction requires three years to be accomplished, after which the increase to the growth rate is realized and added to baseline GDP growth.
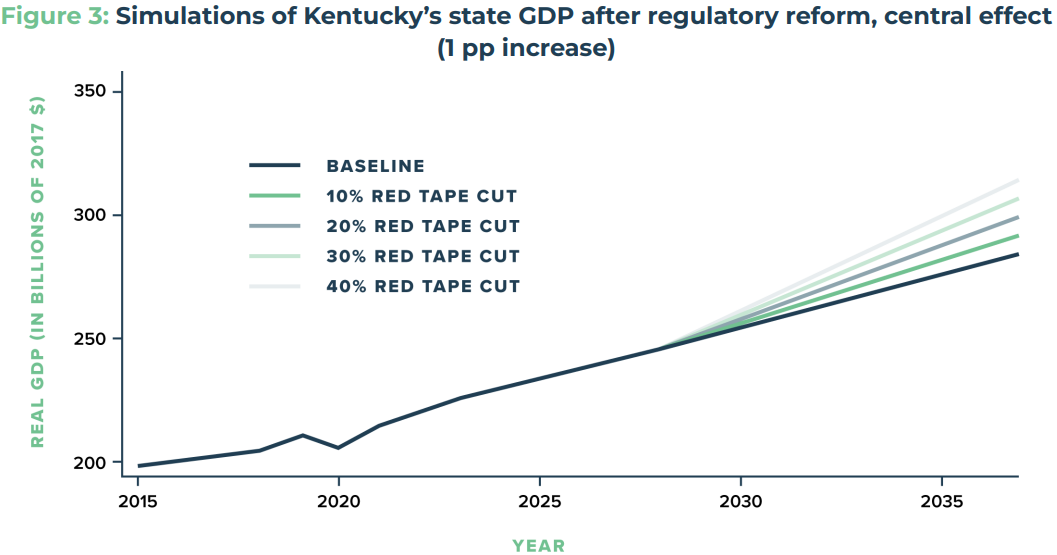
Again, the baseline scenario assumes a 1.64% growth rate. By 2037, at 1.64% growth, Kentucky state GDP would equal $285 billion (in real 2017 dollars). Using the central effect of a 1 pp increase for a 36% red-tape reduction, a modest 20% red-tape cut would make the economy $14 billion larger by 2037. A 40% reduction would yield an economy that is over $20 billion larger by 2037. Table 2 shows the full range of estimates of the difference between the baseline estimate of the economy’s size in 2037 and the alternative economy that would result from the regulatory reform outcome.
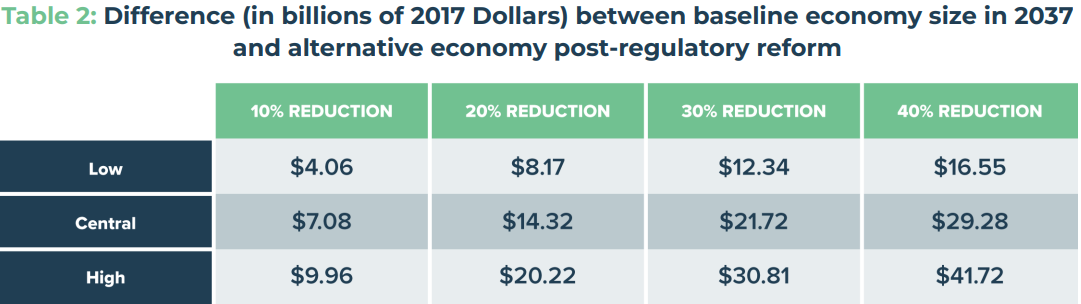
As Table 2 shows, the high effect scenario with a 40% reduction would add nearly $42 billion dollars to the state’s economy by 2037.
Conclusion
Kentucky faces a critical opportunity to harness its economic potential by reducing regulatory burdens. As demonstrated by the experiences of British Columbia, systematic regulatory reform not only increases GDP growth but also fosters innovation, creates jobs, and enhances competitiveness. By adopting a regulatory reduction target over the next three years, Kentucky can unlock billions of dollars in additional economic output and position itself as a leader in business innovation and economic dynamism. The simulations presented here show that even modest cuts, such as 10%, could yield substantial benefits, while deeper reforms could transform Kentucky into an Appalachian hub for innovation, investment, and entrepreneurship.
Patrick A. McLaughlin is a Research Fellow at the Hoover Institution at Stanford University and a Visiting Research Fellow at Pacific Legal Foundation.
The Bluegrass Institute works with Kentuckians, pro-liberty coalitions, grassroots organizations and business owners to advance freedom and prosperity by promoting individual liberty, limited and transparent government, and free markets.